analysis with public DMC data
behind the data: rainfall in chile
Is it raining more or less than normal? A shower in Santiago makes the news, but behind it are 26 stations, from Arica to Antarctica, and over a century of records.
Every day we process the official figures of the Chilean Meteorological Office and check the rainfall so far this year, station by station, against its bulletin.
Updated every day. Source: Chilean Meteorological Office (DMC), climate bulletin and rainfall records.
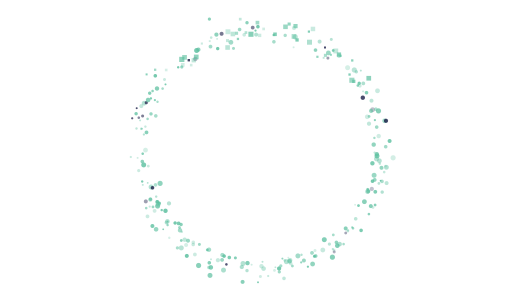
rainfall each year in santiago (quinta normal)
- megadrought years, 2010–2022
- the other years, since 1969
- normal: 286 mm a year (1991–2020)
the history in four figures
a country with every climate.
- stations
- 26
- from Arica to Antarctica, with the DMC's official figures
- more rain in Valdivia than in Iquique
- 1,900 times
- 1,722 mm versus 0.9 mm in a normal year
- years below normal in Santiago
- 13 of 13
- from 2010 to 2022, at Quinta Normal
- the driest year in Santiago
- 82 mm
- 2019, 71% below normal
what the data shows
what a shower doesn't tell you.
The megadrought, in the data
From 2010 to 2022 it rained less than normal in 87% of the years at the central stations and in 84% at the southern ones. From 1991 to 2009 that had happened in a third of the years.
From the driest desert to Patagonia
In Iquique the normal is less than a millimeter a year; in Valdivia, 1,722. That's why in the north the analysis compares in millimeters: one shower moves the percentage by hundreds of points.
Santiago, between very dry and very wet years
Quinta Normal got 82 mm in 2019 and 712 mm in 1987. A normal year is 286 mm: the average hides very different years.
It matches the official figures, every day
The rainfall so far this year, last year to the same date and the deficit are checked against the DMC bulletin at every station. If a figure doesn't match, that day nothing is published.
the full analysis
every station, with its history.
Four views: how much it has rained this year at each station compared with normal, each city month by month, the history since records began and how it's built. Updated every day with the DMC bulletin.
The dashboard is designed for large screens: on a phone, rotate it or zoom in to read the details.
Rainfall so far this year and last year to the same date match the DMC climate bulletin to a tenth of a millimeter.
new: MCP for AI agents
ask the data from your AI agent
Connect Claude, ChatGPT, Google's Antigravity or another agent to the semantic layer of this analysis. Your agent picks the metrics and the semantic layer computes the figure: they're the same as the dashboard's and the model doesn't make them up. If you already have access to the labor market MCP, your key works here too.
connect my agent →- Sign up with your email and pick your agent.
- Get your personal access and setup steps by email.
- Ask in your own words: “how much has it rained this year in Concepción compared with normal?”
or try it here, nothing to install
ask the agent
An agent powered by Claude Haiku uses the same MCP: it picks the metrics, queries the semantic layer and, when it helps, draws the chart with dbt Charts. Here a fast, basic model answers using DMC data only. With your own agent (Claude, ChatGPT or Antigravity) answers are usually fuller and you can combine this data with your other sources: your files, your databases or the web. Try it here without signing up and, if it helps, connect yours.
Type your question or try one of these:
Data: Chilean Meteorological Office (DMC), processed by Datalized. An AI model answers with figures from the semantic layer: check them on the dashboard before quoting them. Questions are logged to keep the service safe. Protected by reCAPTCHA: Google's Privacy Policy and Terms of Service apply.
how we built it
what gets published can be checked.
- 01 · Prefect · Python · DuckDB
Daily ingestion
Every day, after the DMC publishes its bulletin, a process downloads the figures for the 26 stations and loads them into DuckDB. If the DMC's data doesn't match yet, it retries later.
- 02 · dbt
Model and checks
dbt computes rainfall by month and year and each station's normal, and compares the year's figures with the official bulletin. If a figure doesn't match, nothing is published that day and the dashboard keeps the previous version.
- 03 · dbt Charts · MetricFlow
Dashboards and agents
The dashboard and the MCP for AI agents read the same verified tables. For agents, every metric is defined only once: they pick it, they don't write SQL.
want this same thing with your organization's data?
Sources integrated once, verified metrics and dashboards versioned as code. First we talk about your challenge, then you get a proposal.
let's talk about your case →